About Us


MechanoProtein-DataBase

About MechanoPro-DataBase

Mechanical forces are involved in a variety of biological processes, including protein degradation, cell adhesion, tissue organization, and muscle contraction in multicellular organisms. Proteins are the main participants in these events. These nanomachines are subjected of exert mechanical force in diverse biological processes at cellular, subcellular and even molecular level. As a result, studying the mechanical responses of these biomolecules will yield a wealth of knowledge about their structure and function. The use of nanotechnologies, such as optical tweezers and atomic force microscopy, at the single molecule level to understand biological phenomena has accelerated experimental characterization of mechanical reaction of biomolecules and have made significant strides in understanding. Steered Molecular Dynamics simulations, on the other hand enable us to access atomistic details. MechanoProDataBase stores experimental data from force spectrsocpy experiments and computational data from simulatons.

You will find below a detailed tutorial that will help you get familiar with MechanoProDB. A the bottom of the page, a video shows you the different steps that have been detailed.

Tutorial

In the main page, statistics of the database are displayed. 1) In the first plot, situated in the middle of the page, force versus velocity is shown.
Each protein classification is displayed with a different color. The Classification corresponds to the one displayed in the Protein Data Bank (PDB). Click on the class if you want to make it disapear from the graph. You can zoom the total plot in and out using the tab that appears on the up right side when you hover on the plot. You can also make selections of specefic regions of your interest and zoom them in/out. If you click on the pen that shows on the top right of the tab, a table containing data displays giving you the possibility to edit the plot or create new traces.
2) On the bottom of the main page. Three other plots are shown. The first one, on the left, gives an overview of protein folds that are stored within the database. The percentage of each protein folds is displayed in a pie plot. Proteins have been clustered in MechanoProDB according to their secondary structure composition. Proteins that are composed of only beta-strands are classified as All beta proteins. The ones containing only alpha-helices are are classified as All-alpha whereas proteins containing both alpha and beta strands are stored as a/b if the beta strands and alpha helices are alternating and a+b if they are segregated. The plot in the middle, shows a boxplot of minimum, maximum and mean forces of each protein fold. The third plot on the left represents each functional class versus the minimum (in blue) and maximum (in orange) forces in pN. Main Page

3) To display all the available proteins, click on enter the database, or Data (in the main menu). In this page, you have the possbility to filter avaialble data by simply clicking on the name of the column you want to filter by. You can also search for the protein of your interest by using the search entry (top right). Witin the entry you get to type in the information that you are looking for. For example, you can enter the PDB ID , name or technique of your protein. Search

4) The unfolding pathway describes the steps according to which the protein unfolds. In this example, scaffoldin unfolds through one step: N_U[48.6] The protein goes from Native to Unfolded and the Contour Length that is reported here corresponds to 48.6 nm. Other proteins need more than one step to unfold. Consequently, intermediaite steps can be observed, we report these as I. For example, the unfolding pathway of GFP protein (PDB ID: 1EMB) is reported in MPDB as the following: N_I[39.3]_U[72.08]. This annotation shows that GFP goes through an intermediaite step (I) at which the contour length corresponds to 39.3 nm. GFP 
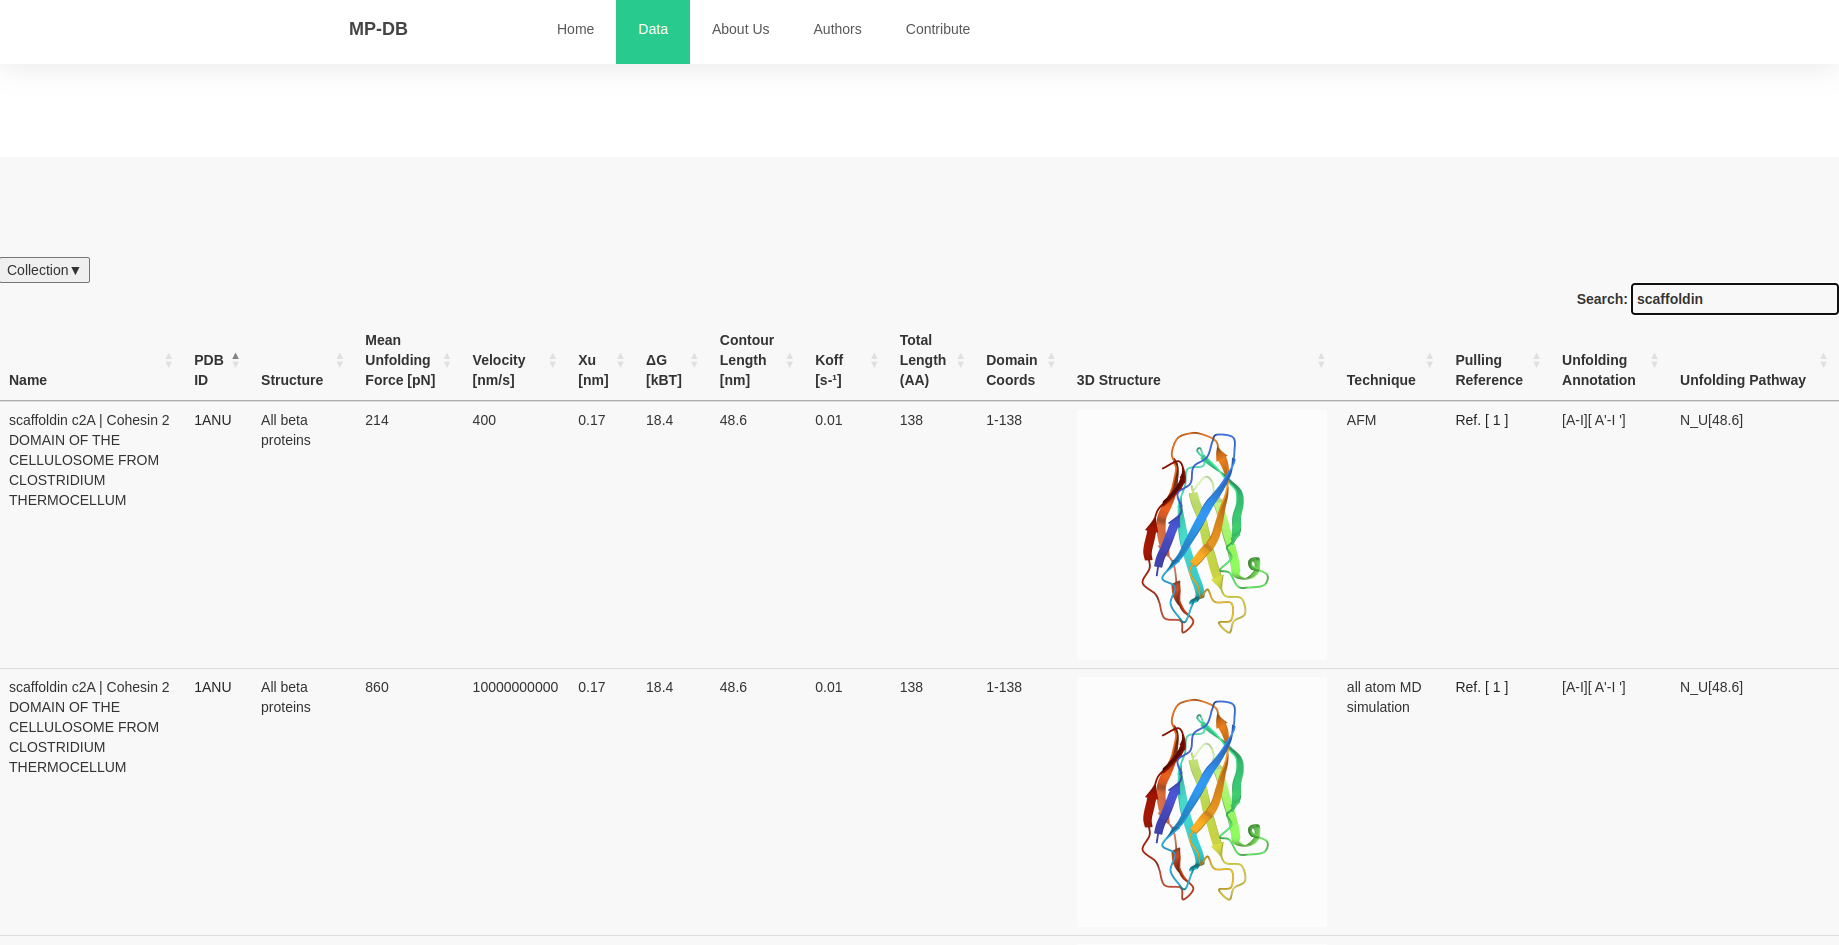
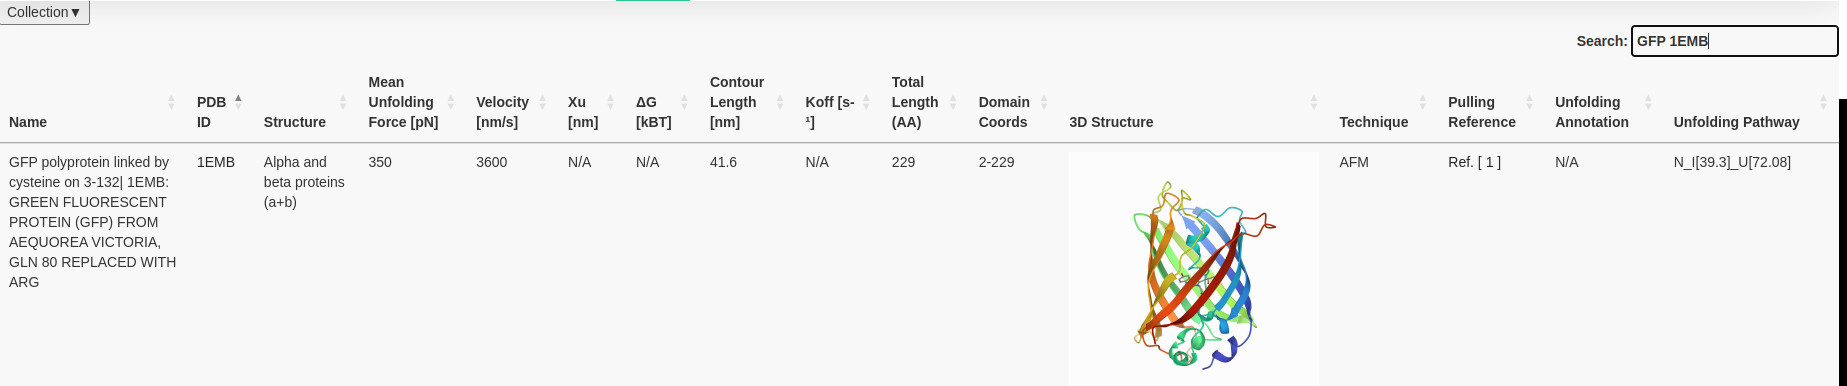
You have the possibility to display the information you want to see by clicking at collections (top left) and selecting or unselection the columns you do not want to see. This tab, gives you also the possibility to download the available data to CSV. NB: Since one AFM based force spectroscopy experiment can result in different unfolding forces at different velocities/loading rates, we display all available data points provided within the manuscript.

5) You can display the 3-D structure of the protein of your interest with its sequence. To do so click on the protein Snapshot in the 3D structure column. Below, an example of Scaffoldin diplayed using the MolStars plugin. 3D

6) Contribution: You have the possbility to contribute and make the database grow by inserting more data. To facilitate this process we provide an insertion page. If the protein structure has been solved experimentally, users must tick the I have the PDB ID button. A python script will scrap data (mutations, organism, SCOP annotation..etc) from the PDB databank which avoids you filling it manually. If the protein does not have an available structure in the PDB data bank; you will have as much information as possbile. A file containing data points can also be uploaded within this page. Insertion

Here's a quick tutorial video that shows the options listed before.

Data Availability


All data is freely available and downloadable.
You can download protein data using the collections tab (top left).
The database is downloadable in SQL format locally as well as the source code: Check our GitLab